


Don’t Buy Bitcoin Until This Happens: A Comprehensive Market Analysis
Understanding Bitcoin’s Most Severe Market Correction
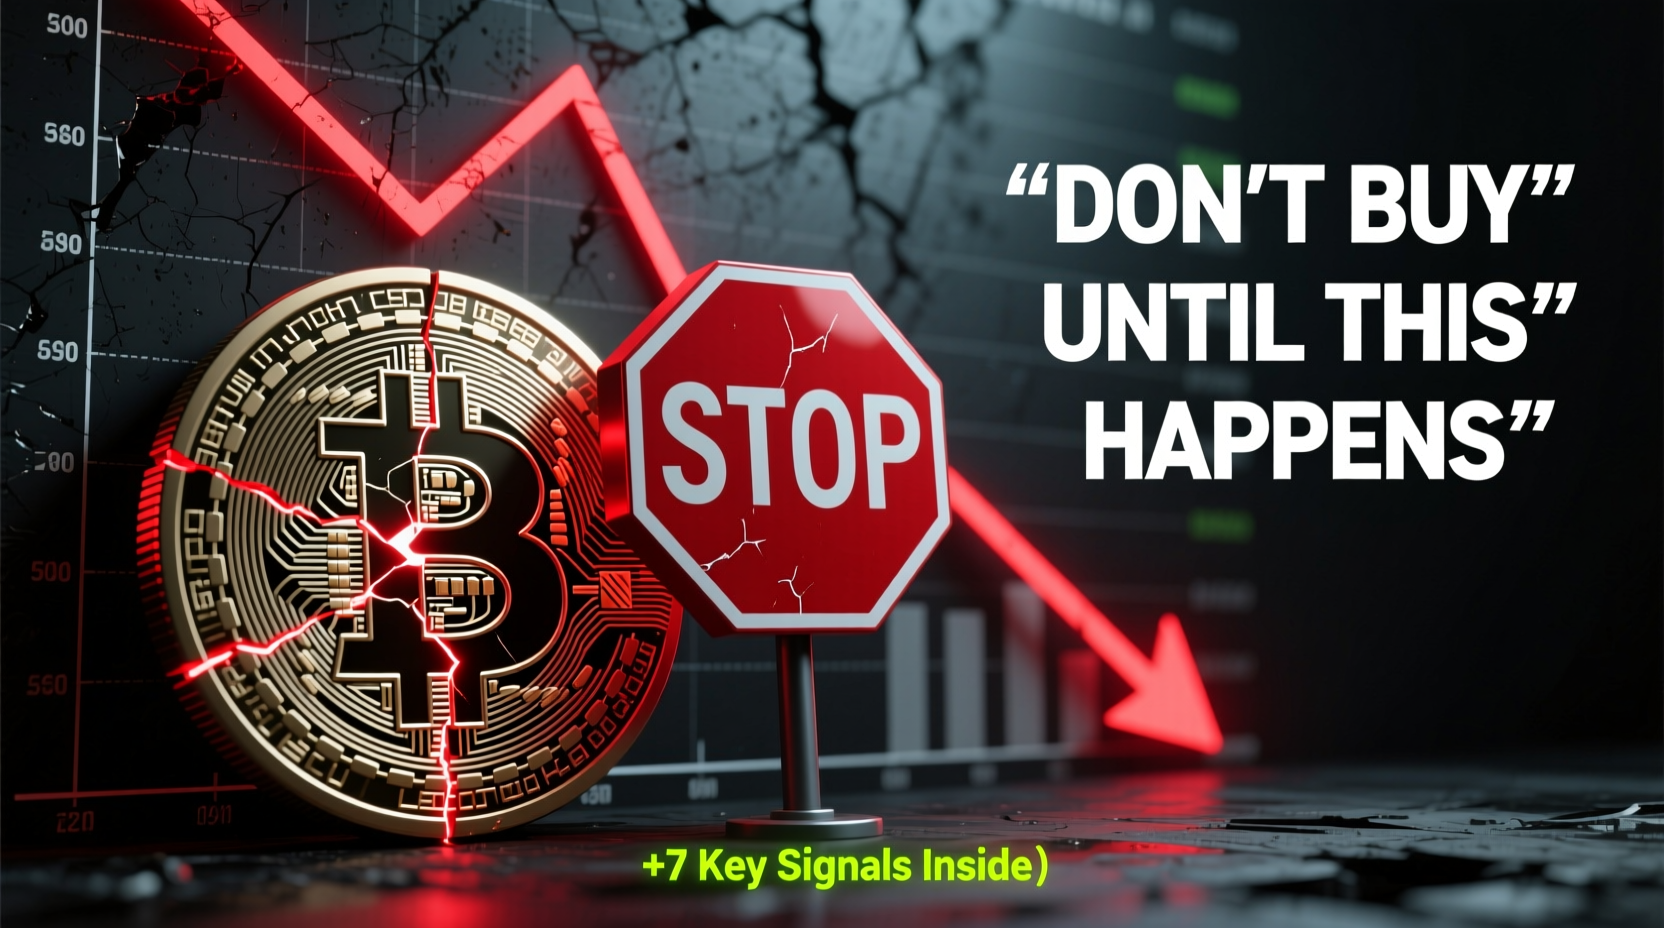
The cryptocurrency market has entered unprecedented territory, with Bitcoin experiencing what can only be described as the most severe decline in its entire history. When measuring the severity of market corrections, we must look beyond simple percentage drops and examine the absolute dollar values lost over specific timeframes. This approach provides a more accurate picture of the magnitude of market stress and capital destruction.
The current correction has seen Bitcoin lose approximately $40,000 in value over a mere 45-day period. To put this in perspective, previous major corrections during past cycles saw declines of roughly $35,000, with movements like the drop from $65,000 to $30,000, and the fall from $69,000 to approximately $34,000. While these were certainly significant market events, they pale in comparison to the current situation both in terms of absolute dollar losses and the speed at which they occurred.
The 45-day timeframe for this correction is particularly noteworthy because it represents the fastest major decline Bitcoin has ever experienced. This rapid deterioration suggests a fundamental shift in market dynamics and investor sentiment that demands careful analysis before considering any long-term positioning.
The Nature of Market Tops and Bottoms
One of the most critical concepts for investors to understand is that market tops and bottoms are not singular events but rather extended processes. The notion that a bell rings at the exact top or bottom of a market cycle is a dangerous misconception that has cost countless investors significant capital over the years.
Market tops typically form through a distribution phase, where smart money gradually exits positions while retail investors continue to accumulate. This process can take weeks or even months, with multiple false signals along the way. Similarly, bottoms form through accumulation phases, where patient capital slowly builds positions while fearful investors continue to sell.
Historical examples illustrate this concept clearly. Consider the events of 2022, when many investors believed the low was established in June following the Luna and Terra collapse. However, the market found another significant low in September, only to be followed by the FTX collapse in November, which drove prices marginally lower still. The actual bottom wasn’t truly confirmed until well into the recovery phase when it became clear that the market could sustain higher prices despite continuing negative news flow.
The current market situation requires similar patience and analytical discipline. Those waiting for a clear, unambiguous signal that the bottom is in will likely miss the early stages of any recovery. Conversely, those who buy too aggressively during the distribution phase risk catching a falling knife.
The Critical Importance of Accumulation Periods
The relationship between accumulation time and subsequent rally strength is one of the most reliable patterns in financial market history, extending well beyond cryptocurrency into traditional asset classes over hundreds of years. When markets have sufficient time to build a base through extended accumulation, the resulting rallies tend to be powerful and sustained. Conversely, short accumulation periods, especially following significant rallies, typically produce weaker subsequent moves.
Think of this dynamic like a fuel tank. A long accumulation period fills the tank completely, providing enough energy for a powerful breakout to new price levels. A short accumulation period leaves the tank only partially filled, limiting the potential for sustained upward movement. When markets attempt to rally on insufficient accumulation, they often create what traders call “bull traps,” where prices temporarily push higher before failing and reversing back down.
The January 20th inauguration day provides a perfect example of this phenomenon in action. The market experienced a brief surge of enthusiasm, touching a new all-time high by approximately $1,000, which represents less than one percent at those price levels. However, without adequate accumulation time to support sustained buying pressure, the rally immediately failed, and prices came crashing back down.
This pattern suggests that unless Bitcoin establishes an extended base-building phase, any near-term rallies should be viewed with skepticism. The market may well test previous highs or even marginally exceed them, but without proper accumulation, such moves are likely to be short-lived and ultimately disappointing for long-term holders.
Avoiding Extremes: The Balanced Approach to Market Analysis
The cryptocurrency space has become increasingly polarized, with investors and commentators often taking extreme positions on either side of the spectrum. On one end, we have the perpetual skeptics who believe Bitcoin and cryptocurrencies have no fundamental value and are destined to fail. On the other end, we have zealots who view Bitcoin as humanity’s salvation and the only asset worth holding.
Both extremes are dangerous and can lead to poor investment decisions. History demonstrates repeatedly that rigid ideological positions in financial markets lead to carnage and substantial losses. Whether examining historical wars, economic collapses, or market bubbles, the pattern is consistent: those who refuse to adapt to changing conditions suffer the most severe consequences.
A more effective approach involves maintaining flexibility and responding to what the market actually does rather than what we believe it should do. This means being prepared to go long when trends indicate strength and willing to step aside or hedge when trends deteriorate. The goal is not to be permanently bullish or bearish, but rather to flow with the prevailing trend, adapting positions as conditions change.
This balanced approach allows investors to participate in bull markets without becoming complacent, and to preserve capital in bear markets without missing opportunities for recovery. It requires discipline, emotional control, and a willingness to admit when initial assessments were incorrect.
Understanding Herd Mentality and Narrative Traps
Both bulls and bears in the cryptocurrency market frequently fall victim to narrative-driven thinking, where they latch onto specific stories or theories that support their predetermined positions. These narratives often involve macroeconomic factors such as central bank policy, government crypto reserves, money printing, interest rate decisions, and optimistic price predictions from high-profile analysts.
The problem with narrative-driven investing is that it prioritizes the story over actual price action and market structure. Investors become so committed to their narrative that they ignore contrary evidence, leading to significant losses when reality diverges from expectations.
A particularly instructive example involves global liquidity analysis, which gained significant attention approximately eight months prior to the current market situation. Proponents of this approach pointed to various global liquidity indices, some offset by 70 days, others by 100 days, and some with no offset at all. The theory suggested that rising global liquidity would inevitably drive Bitcoin prices higher.
However, historical analysis reveals a more complex relationship. Global liquidity indices often continue rising even as Bitcoin prices decline, particularly near market peaks. In some cases, the global liquidity index peaks while Bitcoin continues climbing, only for Bitcoin to then decline while liquidity remains elevated. The timing divergence between liquidity peaks and Bitcoin tops can vary from weeks to months, making it an unreliable timing tool for market entry and exit decisions.
Rather than relying on narrative-driven indicators, a more robust approach involves watching for news failures. A news failure occurs when negative developments that should theoretically drive prices lower fail to do so. For example, if expectations for quantitative easing, stimulus checks, or interest rate cuts fail to materialize, yet the market holds its ground or hovers at similar price levels, this suggests underlying strength despite negative news flow.
The 2022 market bottom provides an excellent example of a news failure in action. When FTX collapsed, involving billions of dollars in customer losses, Bitcoin fell only marginally below the June low established after the Luna and Terra collapse. This 11-12% additional decline was remarkably modest given the magnitude of the FTX disaster. The market then stabilized below that low for an extended period while negative news continued to flow, before eventually breaking out and rallying strongly. This price action demonstrated that the market was no longer responding to negative news in the expected manner, signaling that a bottom was forming.
Bull Market Peak Indicators: Why They Failed
Many analysts and traders rely on Bitcoin-specific indicators that purportedly signal market tops based on patterns from previous cycles. These indicators gained popularity during the 2017 and 2021 bull markets and were widely watched heading into the most recent peak. However, not a single one of these traditional bull market peak indicators triggered during the recent cycle, which tells us something important about over-reliance on cycle-specific metrics.
The fundamental problem with these indicators is that they are backward-looking, based entirely on patterns observed in previous cycles. They assume that Bitcoin will continue to follow the same mathematical relationships and behavioral patterns indefinitely. This assumption ignores the reality that markets evolve, participant bases change, and new dynamics emerge as assets mature.
Bitcoin-specific indicators are particularly problematic because they lack the robust historical foundation that comes from analysis across multiple asset classes and extended time periods. The old trading axiom states that all models are useful until they break, and when they break, investors who relied exclusively on them are left without alternative frameworks for understanding market conditions.
A more reliable approach involves using time-tested signals that have proven effective across different markets and historical periods. Rather than depending on any single indicator, successful market analysis requires looking at multiple signals from different perspectives. When several independent signals align, they build a weight of evidence that justifies position changes. This is particularly important because tops and bottoms are processes, not single-point events, and therefore require multiple confirming signals before taking decisive action.
Positive and Negative Signals: The Current Balance
In analyzing the current market situation, we must objectively assess both positive and negative signals to form a balanced view of probabilities going forward. This evaluation helps determine whether conditions favor accumulation, distribution, or neutrality.
Positive Signals
The macro 50% level, which currently sits at approximately $71,000, has not yet been definitively broken. This level represents the midpoint of the entire bull market rally and serves as a critical threshold for confirming a major trend change. While price has moved significantly closer to this level, it has not yet closed below it with conviction. Maintaining above this threshold provides at least some technical support for the possibility of another rally attempt.
However, it’s crucial to understand that by the time this level is broken, a substantial portion of gains would already be surrendered. This is the nature of insurance-based confirmation signals: they reduce the risk of false signals but come at the cost of giving back significant profits.
Additionally, an overbalance in time and price has not yet occurred. While the market has certainly experienced an overbalance in price, having corrected well past $90,000, it has not yet extended sufficiently in time. The expected correction timeframe would extend to approximately late February or early March 2026. If prices remain suppressed beneath current resistance levels through that period, it would complete the time component of the overbalance, significantly increasing the probability of continued weakness.
Negative Signals
On the negative side of the ledger, several important technical signals have already triggered. The weekly 50% level has been broken, with prices falling through the $100,000 zone. This breakdown represents a significant technical failure and suggests that any near-term rally must reclaim at least the $100,000 level to demonstrate meaningful strength.
For a rally to build real momentum, it would need to clear several resistance layers. The first stands around $100,000, marked by recent swing lows at $98,000-$99,000 and the weekly 50% level. Beyond that, prices would need to push through approximately $108,000, which marks the midpoint of the recent trading range, and then clear $116,000, where the double top formation occurred. Only by successfully navigating these resistance zones could the market demonstrate the strength necessary to challenge for new all-time highs.
Swing charts on both daily and weekly timeframes have turned decisively bearish, printing lower highs and lower lows. This is the most basic and reliable definition of a downtrend, and it signals that the path of least resistance is currently to the downside. Until these swing patterns reverse with confirmed higher lows and higher highs, the trend remains down regardless of short-term bounces.
Volume analysis adds further confirmation to the bearish case. Selling volume has been consistently exceeding buying volume throughout the decline. The red bars on volume indicators have been substantially larger than green bars, indicating more aggressive selling pressure than buying interest. This pattern has persisted through multiple attempted rallies, with each rally showing progressively weaker volume than the preceding selling waves.
For a legitimate reversal to occur, volume patterns would need to shift dramatically. We would need to see strong volume on green bars that exceeds recent red bar volume, sustained over multiple weeks. Historical bottoms show exactly this pattern, with initial strong buying volume followed by consistent follow-through that exceeds selling pressure even during minor pullbacks.
The Altcoin Season That Never Came
One of the most reliable patterns in previous cryptocurrency bull markets has been the rotation of capital from Bitcoin into alternative cryptocurrencies during the latter stages of bull runs. This phenomenon, commonly called “alt season,” typically sees alternative cryptocurrencies dramatically outperforming Bitcoin as speculative fever reaches its peak.
However, this cycle has been notably different. Despite Bitcoin reaching new all-time highs, the expected alt season never materialized in its traditional form. Most alternative cryptocurrencies failed to reach their previous cycle highs, and many actually declined in value even as Bitcoin rallied. This divergence suggests a fundamental change in market dynamics and capital flows.
The absence of a true alt season has significant implications for market analysis. It suggests that speculative excess never reached the levels typically associated with major market tops. Conversely, it could indicate that capital is increasingly concentrating in Bitcoin and a smaller number of major cryptocurrencies, potentially reducing the total addressable market for the broader crypto ecosystem.
Investors who purchased alternative cryptocurrencies expecting a traditional alt season have suffered substantial losses, and many continue to buy dips based on the assumption that historical patterns will reassert themselves. This strategy has been consistently punished throughout the current cycle, highlighting the danger of fighting the market based on expectations rather than responding to actual price action.
Time Frame Analysis and Cycle Patterns
One of the most striking aspects of the current cycle has been how closely it has followed the time frame patterns of previous cycles, at least in terms of the duration from low to high. The most recent bull run lasted approximately 1,150 days from the cycle low to the peak. This compares remarkably well with previous cycles that saw 1,060 days and 1,068 days from low to high.
This consistency in time frames suggests that certain rhythms and patterns in the cryptocurrency market remain intact despite changing fundamentals and market structure. However, it’s crucial not to over-interpret this consistency. Just because the time from low to high matched previous cycles doesn’t mean the subsequent correction will follow historical patterns in duration or magnitude.
A particularly concerning signal emerged in the daily bar count leading into the recent low. The market printed eight consecutive days of lower highs and lower lows, something that typically doesn’t occur during healthy bull markets. The only other time a similar pattern appeared was at a significant peak that preceded an extended correction. This pattern, combined with the overbalance in time and price at that previous peak and extreme greed readings, created a cluster of warning signals that proved prescient.
At that previous peak, analysis clearly indicated the market needed to reclaim and hold above $60,500 to suggest any possibility of resuming the uptrend. Despite widespread optimism and expectations for $80,000, the structure had already broken, and the market instead embarked on a significant decline. This episode demonstrates the importance of respecting technical structure over narrative-based optimism.
Sentiment Analysis and the Fear-Greed Index
Market sentiment, as measured by fear and greed indices, provides important context for understanding the emotional state of market participants. During healthy bull markets, sentiment typically oscillates between fear and greed, occasionally touching extreme greed at local tops before pulling back and rebounding into greed again during the next rally leg.
The current cycle has shown a distinctly different pattern. Since October, sentiment has remained predominantly beneath the greed threshold, which is highly unusual for a supposed bull market environment. When sentiment does breach into greed territory, the subsequent price rallies have been disappointingly weak and short-lived.
Examining the pattern more closely reveals a concerning trend. In January, sentiment briefly touched greed before plunging into extreme fear. The subsequent rally took sentiment back toward greed, but the price pattern showed a lower low in price terms while sentiment made a higher low. This divergence initially appeared positive, suggesting that market participants were becoming less fearful at lower prices, which could indicate a bottom formation.
However, as prices rallied from that point, sentiment struggled to maintain greed levels. Each move back into greed territory was followed by an immediate pullback, and the greed peaks themselves were becoming progressively weaker. The July rally showed the strongest sentiment reading, followed by slightly lower peaks in August and October. Throughout this entire period, overall sentiment was deteriorating even as prices made marginal new highs.
This pattern is particularly bearish because historically, when sentiment falls to these levels and remains suppressed for extended periods, markets typically enter bear phases rather than resuming bull trends. For a genuine turnaround to occur, sentiment would need to break back into greed and establish a pattern of bouncing between extreme fear or fear zones back up into greed repeatedly. This would demonstrate that investor psychology has stabilized and buying interest is returning.
Comparing the current sentiment pattern to previous bear markets shows concerning similarities. In 2022, after the initial collapse from greed into extreme fear, sentiment only marginally touched greed once more on a weak rally into a lower high. This proved to be an excellent sell signal, as the market then remained below greed levels for the duration of the bear market. The 2018 bear market showed a similar pattern, with lower highs on sentiment readings as the market ground lower.
Many investors mistakenly interpret extreme fear readings as automatic buy signals, assuming that maximum pessimism must coincide with market bottoms. However, this interpretation ignores the reality that extended bear markets can maintain fear and extreme fear readings for months or even years. The emotion is a symptom of price action, not a cause, and extreme fear can persist throughout entire bear cycles.
The Three-Day Signal and Historical Accuracy
Among the various technical signals used to identify major market turning points, the three-day signal has proven to be one of the most reliable throughout Bitcoin’s history. This signal has successfully identified every major all-time high in Bitcoin’s existence, making it particularly worthy of attention in current market analysis.
The signal involves identifying three consecutive days of declining prices from a significant turning point, with each day making lower highs and lower lows. While this might seem like a simple pattern, its effectiveness comes from the specific context in which it appears: at major inflection points following extended rallies.
Historical examples demonstrate the signal’s reliability. It identified the 2017 all-time high, the major high in April of that cycle, the October high, and more recently, the March and December peaks in the last cycle. Most notably, it triggered at the October top in the current cycle, providing advance warning of the significant correction that followed.
The appearance of this signal suggests that a significant amount of distribution has occurred at the top, with sellers overwhelming buyers for three consecutive sessions. This clustered selling pressure typically indicates that smart money is exiting positions and that the character of the market has changed from accumulation to distribution.
USDT Dominance and Capital Rotation
One of the most revealing metrics for understanding capital flows within the cryptocurrency ecosystem is USDT (Tether) dominance, which measures what percentage of total cryptocurrency market capitalization is held in Tether, the largest stablecoin. Rising USDT dominance indicates that capital is flowing out of cryptocurrencies and into the relative safety of dollar-denominated stablecoins, while falling USDT dominance suggests the opposite.
The current cycle has shown a dramatic and concerning pattern in USDT dominance. After establishing a major low, USDT dominance has been forming higher lows and breaking through resistance levels, precisely the opposite of what would be expected during a healthy cryptocurrency bull market. The chart shows a clear uptrend with a breakout, test of a higher low, another breakout, test of another higher low, and continued strength.
This pattern closely mirrors what occurred during the last major bear market, when USDT dominance breaking higher coincided with collapsing cryptocurrency prices. The implication is clear: capital is rotating out of speculative crypto assets and into the safety of stablecoins, indicating a risk-off posture among market participants.
For the cryptocurrency market to resume a bull trend, USDT dominance would need to be decisively rejected at resistance levels and break down below key support zones around the 4.7-4.8% level. Until this occurs, the capital flow pattern suggests continued pressure on cryptocurrency prices. The current level approaching 6.6% represents a significant resistance zone. If this level holds and USDT dominance reverses, it could signal the beginning of renewed risk appetite in crypto markets. However, a breakout above this level would likely coincide with further cryptocurrency weakness.
The higher lows in USDT dominance formed throughout November, July, and August, all while Bitcoin was putting in higher highs. This divergence indicated that something fundamental was changing in market dynamics even as prices reached new peaks. Capital was already beginning to rotate away from cryptocurrencies before the obvious price breakdown occurred, providing advance warning to those monitoring capital flows.
Traditional Markets and the Risk Environment
Bitcoin and cryptocurrencies do not exist in a vacuum but rather operate within the broader context of global financial markets. Understanding the health and direction of traditional markets provides essential context for cryptocurrency analysis, as risk appetite across all asset classes tends to rise and fall together.
The US Dollar and Commodity Pressure
The US dollar has been strengthening significantly, which typically creates headwinds for commodities and risk assets including Bitcoin. The dollar formed important bottoms in July and September, right around the time Bitcoin was forming its top. This inverse relationship is not coincidental: a rising dollar makes dollar-denominated assets like Bitcoin less attractive to international buyers and reflects a general flight to safety.
The dollar has broken above the 100 level, a psychologically and technically significant threshold, and appears to be targeting approximately 103 in the short term, which represents the 50% retracement of its prior decline. This continued dollar strength suggests the risk-off environment may persist for some time.
However, longer-term analysis suggests the dollar may eventually decline from these elevated levels. If and when this occurs, it could provide a more favorable backdrop for Bitcoin and other risk assets to rally. The critical question becomes: how much will Bitcoin decline before the dollar tops, and will Bitcoin find adequate support to stage a meaningful recovery when dollar pressure finally abates?
Employment Data and Economic Concerns
Recent employment data has added another layer of complexity to the market environment. The unemployment rate has ticked up from 4.3% to 4.4%, continuing a gradual but persistent upward trend. While the current unemployment level remains historically low, the direction of change is concerning.
Historical patterns show that once unemployment begins rising, it typically doesn’t reverse course until something in the economic system breaks, forcing policy response and stimulus measures. There have been only a few instances where unemployment rose modestly and then declined without a significant economic event. However, the current situation has already moved beyond those minor fluctuations.
Unemployment has risen from 3.4-3.5% to 4.4%, representing a 30% increase in the unemployment rate. This magnitude of change is significantly larger than previous minor reversals and suggests underlying economic weakness that may need to work through the system. The most likely historical outcome is that unemployment will continue rising until it triggers some form of economic stress or policy response.
This matters for Bitcoin because rising unemployment typically coincides with risk-off market environments. If the labor market continues deteriorating, it could trigger broader economic concerns that would likely weigh on speculative assets including cryptocurrencies. The investment community finds itself deep into what could be characterized as a winner’s curse phase, where those who benefited from the bull market may face significant reversals as economic conditions deteriorate.
Stock Market Technical Breakdown
The US stock market has shown significant weakness across major indices, creating a decidedly risk-off environment that directly impacts Bitcoin’s prospects. When stock markets are declining, Bitcoin and especially more speculative cryptocurrencies typically struggle as investors reduce overall risk exposure.
The S&P 500 has reached its lowest close since October 10th, when concerns about increased tariffs on China caused a sharp selloff. The market briefly rallied from that point, but has now returned to those lows, suggesting the previous recovery may have been nothing more than a relief rally within a larger downtrend.
This development is particularly significant because it threatens to break the five-year cycle pattern that has been tracked for approximately eight months. This cycle has shown remarkable accuracy in predicting major moves in the stock market, but like all cycle analysis, it will eventually fail if market conditions change sufficiently. The current juncture represents a critical test of whether this five-year cycle will continue operating as expected or whether it has finally run its course.
The NASDAQ index, heavily weighted toward technology stocks including major artificial intelligence beneficiaries, has similarly broken down. The AI narrative that drove substantial gains in technology stocks has taken a significant breather, removing one of the major pillars supporting risk appetite across markets. Some analysts have drawn connections between AI sector weakness and Bitcoin weakness, suggesting that the same speculative capital that flowed into AI stocks also supported cryptocurrency prices.
The Dow Jones Industrial Average has also declined, showing weakness across different market segments and company sizes. Perhaps most notably, the Russell 2000, which represents small-cap companies and is often viewed as a risk-on indicator similar to the altcoin market, has been severely damaged. This broad-based weakness across market capitalizations and sectors indicates genuine risk aversion rather than narrow sector-specific issues.
All of these factors combine to create significant headwinds for Bitcoin. The asset requires a risk-on environment to thrive, with capital flows seeking speculative opportunities and yield. The current market environment is precisely the opposite, with capital flowing toward safety and investors prioritizing capital preservation over growth.
Bitcoin Versus Other Assets: Relative Performance Analysis
One of the most important analytical frameworks for understanding Bitcoin’s true position involves comparing its performance relative to other major assets. This relative analysis helps identify where capital is flowing and whether Bitcoin is gaining or losing market share within the broader investment universe.
The Bitcoin versus gold ratio provides particularly valuable insights. When this ratio is rising, Bitcoin is outperforming gold, suggesting that speculative risk appetite is strong and investors favor growth over safety. When the ratio is falling, gold is outperforming Bitcoin, indicating a flight to safety and preference for traditional store-of-value assets.
Currently, this ratio has been declining, indicating that money is flowing out of Bitcoin and into gold and other traditional assets. This is not simply a matter of Bitcoin falling while gold rises; rather, Bitcoin is experiencing larger losses than gold, demonstrating relative weakness that goes beyond general market conditions.
Similar patterns appear when comparing Bitcoin to major stock indices. The NASDAQ, S&P 500, and Dow Jones all topped earlier than Bitcoin, which is a concerning signal in itself. When these markets break down and begin forming bottoms, we would typically expect to see them stabilize first, establish bases, and then begin rallying. Only after this process would we expect Bitcoin to find its own bottom and begin recovering.
This sequencing is important because it suggests that Bitcoin is unlikely to bottom and begin a sustained rally while traditional markets are still in downtrends. The broader risk environment needs to stabilize first, creating the conditions for capital to once again flow toward more speculative assets like cryptocurrencies.
Timeline Expectations and Correction Duration
Based on the constellation of signals and historical patterns, a working hypothesis for the correction timeline extends through approximately the second quarter to third quarter of 2026. This timeframe allows for the type of extended base-building that would be necessary to support a subsequent sustained rally.
This timeline is supported by analysis of other major cryptocurrencies and related assets that topped ahead of Bitcoin. XRP peaked in July 2025, Ethereum in August 2025, and MicroStrategy around June-July 2025 (following an initial spike in November 2024). In many of these cases, subsequent corrections have lasted approximately 12 months, which would place potential lows in mid-to-late 2026.
However, this timeline comes with significant uncertainty about what follows. Several scenarios are possible, each with different implications for long-term positioning:
The first scenario involves a deep correction followed by a bounce into a lower high, which then fades for the remainder of the current 18-year cycle. In this case, the multi-year perspective suggests we are heading toward a larger structural bear market, not merely the typical one-year corrections that have characterized previous Bitcoin cycles.
The second scenario allows for a low formation in 2026 followed by another significant rally before the longer-term bear market begins. This would more closely mirror traditional cycle patterns but would still ultimately lead to an extended period of weakness.
The most bearish scenario suggests that we may be entering a multi-year bear market unlike anything Bitcoin has experienced in its relatively short history. Rather than the familiar pattern of one year down followed by four years up to new all-time highs, this scenario contemplates an extended period of price weakness and base-building before the next major bull cycle can begin.
Conclusion: Maintaining Flexibility in Uncertain Times
The current market environment presents significant challenges for Bitcoin investors. Multiple technical signals have turned bearish, sentiment remains depressed, capital is flowing out of cryptocurrencies into stablecoins, traditional markets are weak, and the macroeconomic backdrop is deteriorating. These conditions strongly suggest that patience is warranted before committing significant capital to long-term Bitcoin positions.
However, markets are dynamic and conditions can change rapidly. The key to successful navigation is maintaining flexibility rather than becoming ideologically committed to either bullish or bearish positions. The goal is not to be permanently bullish or bearish, but rather to respond appropriately to what the market actually does.
Specific signals to watch for potential reversal include:
- A decisive break back above $100,000 followed by sustained strength through $108,000 and $116,000
- USDT dominance being rejected at resistance and breaking down below 4.7%
- Sentiment returning to greed levels and maintaining a healthy oscillation pattern
- Traditional markets forming bases and beginning to rally
- Bitcoin establishing relative strength versus gold and major stock indices
- Volume patterns reversing to show stronger buying than selling pressure
- News failures where negative developments fail to drive prices lower
Until a significant number of these signals align to suggest a genuine shift in market character, the prudent approach is to remain patient and preserve capital. The severest decline in Bitcoin’s history deserves respect, and attempting to catch a falling knife based on hope or narrative rather than confirmed evidence has proven costly for many investors throughout this correction.
The path forward remains uncertain, with multiple possible outcomes over the coming quarters and years. Rather than trying to predict the exact future with false confidence, the focus should remain on following a disciplined process that responds to evolving market conditions. This means being prepared to move decisively when opportunity presents itself, but not forcing trades in the absence of genuine confirming evidence.
Those who remain flexible, follow their analytical frameworks rather than their emotions, and avoid becoming zealots for either extreme position will be best positioned to navigate whatever comes next in Bitcoin’s ongoing evolution.